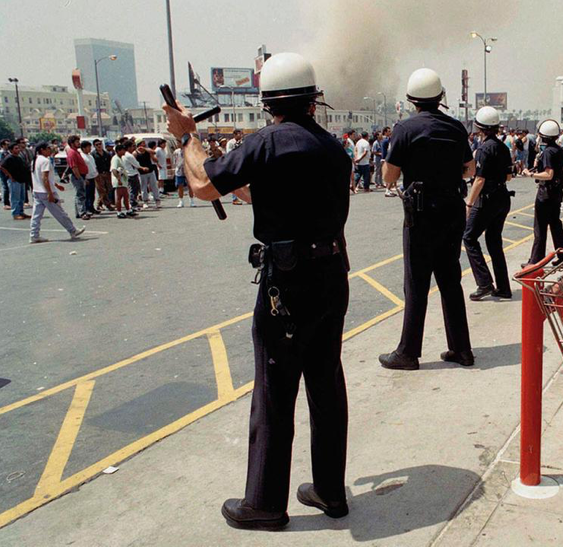
Crime in LA
Why do we care about economic state and crime?
The US economy recently experienced a recession and recovery
According to the National Bureau of Economic Research, the US economy fell into the most recent recession in 2007, which ended in 2009. There were massive increases in unemployment and decreases in consumer spending.
Crime rates are related to the economy
Studies as far back as the 1970s and 80s have shown that there is a relationship between the state of the economy and the occurence of crimes. Since this time, there have been many scientific studies investigating this complex relationship.
Explore this relationship in Los Angeles county
The relationship between crime and the economy is not linear across the nation, states, or cities. Using the tools below, learn about crime in LA County between 2010, immediately following the recession, and 2015, after the economy had recovered. Explore crimes reported to the LA Police Department (LAPD) and compare crime rates in different areas of the county. Run the crime simulator to simulate crimes in your reporting area and examine heatmaps of crime density.
Explore crime reported to the LAPD
Crimes reported to the LAPD are recorded in their database, which is made publicly available for reported crimes from 2010 until present. They have 136 unique crime codes to describe different types of crime. These crimes are described by 43 categories that fall into 9 groups.
Use the tree to explore the types of crimes and their groupings by clicking on the tree to expand and contract branches.
Examine crime rates across LA County over time
Use the map and graphs below to examine the change of crime rates for each of the LAPD reporting districts. Click on a region in the map to show overall changes in crime, crime rankings by percent change, and the change in crime over time (separated by type of crime). Compare the change in overall crime for each district in the slopegraphs below the map. Hover over a slopegraph to highlight the district or click the region on the map to highlight the slopegraph.
Crimes in 2010
Crimes in 2015
Total Change
Percent Change
Crime Type Ranked by Percent Change
Crime Type Ranked by Total Occurence
Simulate crime rates across LAPD reporting districts
Use the crime simulator below to simulate crime rates in different districts. Select a district from the drop-down menu and choose whether to simulate crimes on total population or on total reported crimes in the area. Select your population or total reported crimes size and press the simulate button to generate a fresh simulation. Hover over the icons to explore the types of crimes simulated.
Compare crime density between districts
Compare the density of reported crimes between districts with the heatmaps below. Compare the top five crimes reported in each district as you explore the crime density. Select different districts or compare across 2015 and 2010 by selecting options from the drop down menus.
Explore the relationship between time and reported crimes
Explore the patterns of reported crimes over time in the barchart below. Select different crime categories from the drop down menu and compare the frequency (height) and time (color) of their occurrence across all months in 2015. Compare crime rates and reporting times across the different days of the week. Why is there an abnormally large number of cases of Resisting Arrest on Thursdays in October? (Hint: What day of the week was Halloween in 2015?).
Meet the Team